GISFire, live mapread at 17:38
Every wildfire,seen from orbit, live.
226,255satellite detections in the past 24 hours
Support for monitoring, not an operational alerting system.
Scroll to take off
NASA FIRMS detections. Sentinel-2 cloudless imagery by EOX (CC BY 4.0). Base map by CARTO and OpenStreetMap contributors.
GISFirePro
Already subscribed? Sign inTwelve modules, one single map
The professional workspace is not another application: it is the same map, with a rail of modules that open in a centred window above it. Each module docks beside the map when you work on it, or goes full screen when you read it, and what you click on the map comes back into the module.
Zones
The areas you want watched, drawn by hand or taken from a municipality, with the assets they contain: schools, campsites, industrial sites, networks.
Alerts
Email, urgent SMS and webhook from the first detection in a zone, and on the Pro plan as soon as a fire approaches, smoke arrives or lightning strikes nearby.
Live
Everything that has just changed on the map, continuously: new fires, spread, drops, alerts on your zones, press and lightning.
Fires
Duration, detected extent, power, speed and direction of spread, aerial effort committed, before and after images from Sentinel-2.
Aircraft
Every aircraft, its type, its rotations, its drops and its scooping runs, with a replay of its day and the areas it treated.
Terrain
Relief, slopes, land cover and firebreaks, as layers you switch on one at a time, each with its legend.
Health and smoke
The estimated plume, air quality, and who will be underneath it a few hours from now.
Sketch
An operational sketch drawn on the map, with the symbols of the trade, shareable through a link.
Severity
Damage severity after the fire, computed on Sentinel-2 imagery, with its scale and its acquisition date.
Europe
Continental reference layers and context maps, to place a fire in its season and in its region.
Reports
A laid out, dated and exportable situation report, plus GeoJSON, CSV and KML exports of whatever you are looking at.
Account
Your plan, the areas and surface already used, the urgent SMS number, the users of the organisation and the API keys.

Screenshots of the product, taken on a demonstration account. The figures you read on them come from the database. Nothing is repainted for the photo.
What nobody else does
Nobody announces a water drop. It is inferred.
No authority broadcasts the position of a retardant or water drop. GISFire reconstructs it from the only public signal available, the aircraft's ADS-B: a descent, a very low run over the fire front, a climb. Skimming the pines, the aircraft even drops below the horizon of the receivers, and it is that silence which gives the run away.
13
drops by MILAN78 on 26 July 2026,
in 5.1 hours of flight, inferred from its ADS-B track alone. This is a real day, read from the database, and you can replay it pass by pass.
ADS-B tracking
Reading the tracker...


The load is inferred from the type
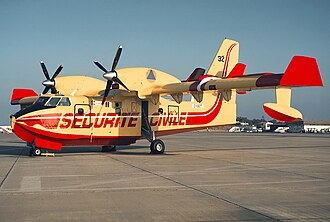
Canadair and Air Tractor for water, Dash 8 and A400M for retardant. The distinction is not cosmetic: water falls on the flames, retardant is laid ahead of the front, on the intended stop line.
A retardant line is an intention
It says where the crews believe the fire is going, not where it is. Read that way it is worth more than a forecast: it is the ground read by the people standing on it.
Scooping counts too
Picking water back up from a lake is recognised in the same way, often several kilometres from the front. The rhythm of those rotations says more about the scale of the response than any press release.
This is an inference, not a declaration: a missed drop or a false positive both remain possible. Every run is therefore shown with its track, so the reading can be checked. Aircraft family photos: Wikimedia Commons, CC BY-SA, credits on the Credits page.

After the fire
47,831
hectares detected at Saumos, in the Gironde.
Saumos, in Gironde: the burn scar, from green to brown, on two passes of the same satellite. Push the slider: same satellite, same framing, six weeks apart.
The detected extent overstates the area actually burnt: it adds up the ground footprints of the pixels, and a 375 metre VIIRS pixel counts for 14 hectares even when only an edge is burning.


In the press
The press quotes GISFire
Probably the handiest tool for a quick visual watch…
 Aquitaine Online · July 26, 2026 · translated from French
Of the three platforms, it is the one that allows the best real-time monitoring.
 Visualisations & décryptages, Cécile Le Chevalier · July 30, 2026 · translated from French
Residents can track active fires in near real time on the public map.
 Monaco Life · July 27, 2026
GISFire's map is very comprehensive: the data is drawn from satellites…
 Actu Bordeaux, Juliette Cardinale · July 28, 2026 · translated from French
…the aircraft deployed and their drops, the path of the wind.
 Québec Nouvelles · July 28, 2026 · translated from French
Lets you follow how fires develop thanks to an interactive map.
 Bouger à Bordeaux · July 28, 2026 · translated from French
Press extracts, linked to their source. GISFire did not solicit any of these mentions.
Plans
The map stays free.
Pro funds the service.
14 days free, no commitment on monthly plans; price per month for yearly billing. Card payment through Stripe. All the plans in detail.
Surveillance
€8.25/ month
excl. VAT, billed €99.00 / year; monthly, €12.00 / month
14-day trial, no commitment
One site to protect: campsite, estate, municipality.
- 3 zones, 25,000 ha monitored
- Email alerts
- Drops, plume, air quality, lightning and firebreaks on the map
- 12-month history, reports
Pro
€82.50/ month
excl. VAT, billed €990.00 / year; monthly, €99.00 / month
14-day trial, no commitment
A data profession: GIS, insurance, forestry management.
- 25 zones, 250,000 ha monitored
- Urgent SMS on top of email
- Alert when a fire approaches, up to 50 km
- Smoke announced before it arrives
- Lightning reported around your zones
- API, exports, webhooks, 5 users
Organisation
On request
billed yearly, scope defined with you
Local authorities, insurers, multi-site groups.
- Zones and users on request
- Everything in the Pro plan
- Monitored area defined with you
- GIS integration, service-level commitment
- Features on request
Compare everything
Monitored zones
Surveillance : 3Pro : 25Organisation : On requestMonitored area
Surveillance : 25,000 haPro : 250,000 haOrganisation : On requestEmail alerts
Surveillance :Pro :Organisation :Five reserved map layers
Surveillance :Pro :Organisation :Urgent SMS on every alert
Surveillance : –Pro :Organisation :Alert for an approaching fire
Surveillance : Inside the zonePro : Up to 50 kmOrganisation : Up to 50 kmSmoke announced before it arrives
Surveillance : –Pro :Organisation :Lightning reported around the zones
Surveillance : –Pro :Organisation :Webhooks to your tools
Surveillance : –Pro :Organisation :API, GeoJSON and CSV exports
Surveillance : –Pro :Organisation :Fire history and exposure
Surveillance : 12 monthsPro : FullOrganisation : FullReports and monthly summary
Surveillance :Pro :Organisation :Users
Surveillance : 1Pro : 5Organisation : On requestGuided GIS integration
Surveillance : –Pro : –Organisation :Priority support, service-level commitment
Surveillance : –Pro : –Organisation :Payment
Surveillance : CardPro : CardOrganisation : Quote, bank transfer
Open the map. The rest explains itself.
Nothing to install, nothing to create. If you have sites to protect, the professional workspace watches them for you and warns you from the very next satellite pass.
Public map, free, no account, in all four languages.