Fire near Carlencas-et-Levas
43.62°N, 3.21°E · first detected on 5 July at 22:19
What the satellites measured
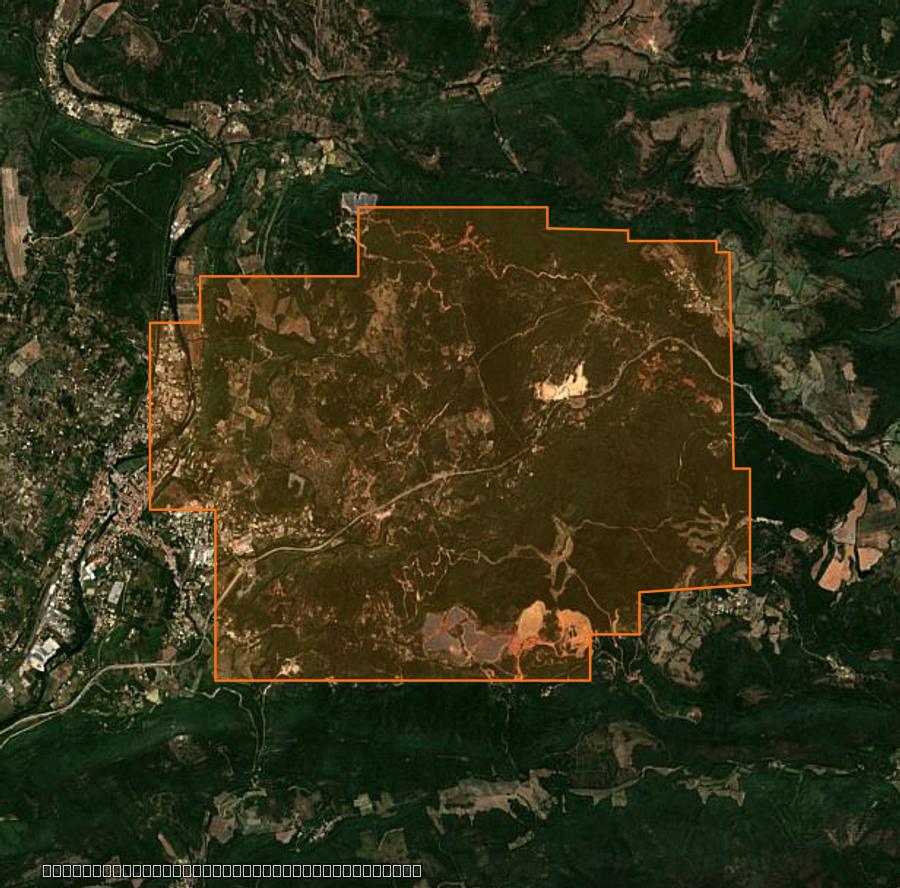
This fire was tracked from 5 July at 22:19 to 8 July at 16:33, that is 3 days, through 119 satellite detections. The detected extent reaches 2,092 ha.
- Detected extent
- 2,092 ha
- Cumulative power
- 3,373 MW
- Peak power, one pixel
- 646 MW
- VIIRS and MODIS detections
- 119
These four figures cover the polar orbits alone, the ones that measure an area. The pass table below also counts geostationary detections, more frequent but too coarse for geometry, and its power column sums a whole pass where the peak above is that of a single pixel.
“Detected extent” is not “burned area”: it is the union of the ground footprints of the satellite pixels, and a pixel counts in full (375 m for VIIRS, 1 km for MODIS) even when only a forest edge is burning. Compared with press figures it is in practice one and a half to three times the area reported. Detections taken at the edge of the scan swath, too coarse to measure anything at all, are excluded. These figures come from thermal detection and are not an official assessment: only the emergency services and the competent authorities are authoritative.
Replay how the fire spread
The map is framed on this fire's footprint and loads only its detections. The timeline below covers the period in which satellites saw it, from the first to the last detection, with twelve hours before and twenty-four after; the ticks on the bar mark the emergency services' announcements that fall within it. The cursor opens on the most powerful pass, and playback replays the whole fire in about thirty seconds. “1 h” shows what is burning within an hour of the chosen moment : the map then follows the power curve below and empties when it falls. “24 h” stacks twenty-four hours : a fire stays visible between two satellite passes, which come two to four times a day. Both are true, but they say different things.
The detected extent
The spread, pass after pass
30 June
before the fire
5 July
during
7 July
during
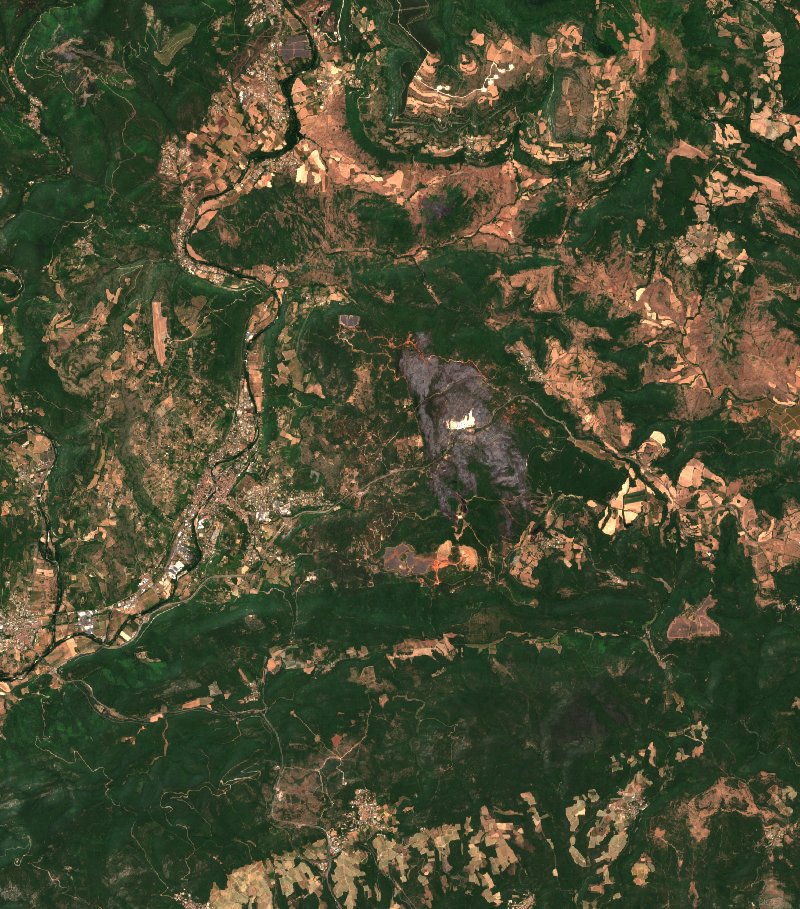
10 July
after
How the radiative power evolved
One point per satellite pass: the sum of the fire radiative power measured over the fire. This is the curve that says whether the fire eased off or picked up again, which no cumulative figure shows. The window covers 5 days; beyond that, clustering would merge two successive fires in the same place.
Fire dynamics
Loading history…
Satellite passes in detail
| Pass | Power summed over the pass | Detections | Sensor |
|---|---|---|---|
| 8 July at 16:33 | 20 MW | 1 | Aqua |
| 8 July at 15:33 | 53 MW | 9 | N |
| 8 July at 14:57 | 100 MW | 7 | N21 |
| 8 July at 14:12 | 298 MW | 5 | N20 |
| 8 July at 13:53 | 640 MW | 16 | N |
| 8 July at 11:32 | 52 MW | 2 | Terra |
| 7 July at 15:57 | 319 MW | 4 | Aqua |
| 7 July at 15:53 | 119 MW | 7 | N |
| 7 July at 15:16 | 59 MW | 3 | N21 |
| 7 July at 14:29 | 111 MW | 2 | N20 |
| 7 July at 14:12 | 121 MW | 1 | N |
| 7 July at 13:36 | 19 MW | 1 | N21 |
| 6 July at 14:49 | 21 MW | 2 | N20 |
| 6 July at 14:29 | 20 MW | 2 | N |
| 6 July at 13:55 | 63 MW | 3 | N21 |
| 6 July at 05:51 | 24 MW | 2 | Aqua |
| 6 July at 05:06 | 21 MW | 8 | N20 |
| 6 July at 04:45 | 30 MW | 15 | N |
| 6 July at 04:13 | 35 MW | 8 | N21 |
| 6 July at 03:26 | 31 MW | 8 | N20 |
| 6 July at 03:05 | 8 MW | 5 | N |
| 5 July at 22:19 | 1,210 MW | 8 | Terra |
Follow live
The map shows active fires in 3D, with smoke plumes, forecast wind, drop zones and the live position of water bombers tracked by ADS-B, anywhere in the world.
Open the fire mapTake the data of this fire with you
A ready-to-use archive, paid once, no subscription. It contains:
- the satellite detections of the fire
- the contours of its progression
- the drops and the aircraft tracks
- the lightning around it
- the severity of the burned area, when computed
From €20.00 excl. VAT, six formats to choose from, link valid for 30 days.
Download the dataPro subscribers: included. €49 excl. VAT a month, no commitment. The public map stays free. Discover GISFire Pro
© 2026 SARO · Gistin. All rights reserved. The interface, its presentation and the contents of GISFire are protected; reproducing or imitating them requires written permission. The source data remain the property of their respective producers, see the credits.