Fire near Piedimulera (IT)
46.03°N, 8.21°E · first detected on 8 August at 14:14
What the satellites measured
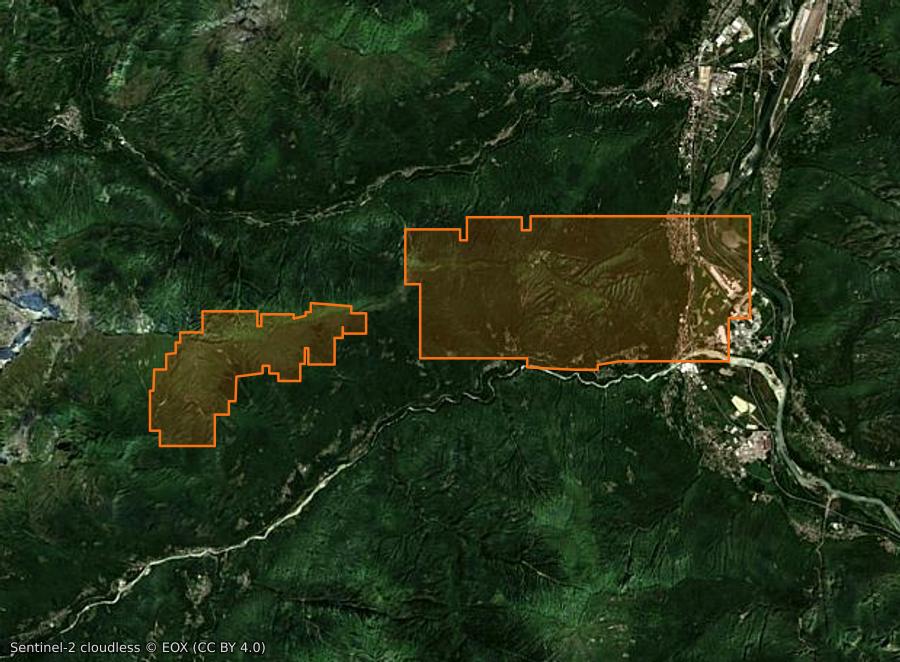
This fire was tracked from 8 August at 14:14 to 19 August at 13:32, that is 11 days, through 280 satellite detections. The detected extent reaches 1,776 ha.
- Detected extent
- 1,776 ha
- Cumulative power
- 1,742 MW
- Peak power
- 41 MW
- Detections
- 280
“Detected extent” is not “burned area”: it is the union of the ground footprints of the satellite pixels, and a 375 m pixel counts in full even when only a forest edge is burning. Compared with press figures it is in practice one and a half to three times the area reported. Detections taken at the edge of the scan swath, too coarse to measure anything at all, are excluded. These figures come from thermal satellite detection and are not an official assessment: only the local fire and civil protection authorities are authoritative.
Replay how the fire spread
The map is framed on this fire and loads only its detections. The timeline below covers the whole known life of the fire — from the first trace, satellite or report, to the last announcement from emergency services — and the ticks on the bar mark those announcements. Detections often stop before containment: a fire stops radiating once it stops spreading, which is exactly when it is declared contained. “1 h” shows what is burning within an hour of the chosen moment : the map then follows the power curve below and empties when it falls. “12 h” stacks twelve hours , as the home map does, where stacking avoids an empty screen between two satellite passes. Both are true, but they say different things.
The detected extent
How the radiative power evolved
One point per satellite pass: the sum of the fire radiative power measured over the fire. This is the curve that says whether the fire eased off or picked up again, which no cumulative figure shows. The window covers 30 days; beyond that, clustering would merge two successive fires in the same place.
Fire dynamics
Loading history…
Satellite passes in detail
| Pass | Power | Detections | Sensor |
|---|---|---|---|
| 16 August at 15:04 | 8 MW | 1 | N |
| 16 August at 14:27 | 20 MW | 2 | N21 |
| 16 August at 10:43 | 14 MW | 2 | Terra |
| 16 August at 05:36 | 7 MW | 1 | Aqua |
| 16 August at 03:56 | 6 MW | 3 | N20 |
| 16 August at 03:37 | 3 MW | 3 | N |
| 16 August at 03:02 | 2 MW | 2 | N21 |
| 15 August at 04:15 | 10 MW | 4 | N20 |
| 15 August at 03:56 | 9 MW | 5 | N |
| 15 August at 03:20 | 18 MW | 7 | N21 |
| 15 August at 02:37 | 31 MW | 5 | N20 |
| 14 August at 22:08 | 25 MW | 2 | Terra |
| 14 August at 14:19 | 93 MW | 5 | N20 |
| 14 August at 14:00 | 92 MW | 7 | N |
| 14 August at 13:25 | 43 MW | 3 | N21 |
| 14 August at 03:39 | 3 MW | 2 | N21 |
| 14 August at 02:54 | 5 MW | 1 | N20 |
| 14 August at 02:35 | 3 MW | 1 | N |
| 13 August at 16:29 | 29 MW | 2 | Aqua |
| 13 August at 15:23 | 17 MW | 2 | N21 |
| 13 August at 14:38 | 22 MW | 3 | N20 |
| 13 August at 14:19 | 21 MW | 3 | N |
| 13 August at 13:45 | 18 MW | 2 | N21 |
| 13 August at 10:24 | 12 MW | 1 | Terra |
| 13 August at 05:21 | 16 MW | 2 | Aqua |
| 13 August at 04:34 | 5 MW | 2 | N |
| 13 August at 03:58 | 14 MW | 2 | N21 |
| 13 August at 03:13 | 21 MW | 6 | N20 |
| 13 August at 02:54 | 16 MW | 4 | N |
| 13 August at 02:18 | 22 MW | 7 | N21 |
| 12 August at 14:57 | 44 MW | 5 | N20 |
| 12 August at 14:38 | 64 MW | 6 | N |
| 12 August at 14:02 | 40 MW | 5 | N21 |
| 12 August at 13:17 | 5 MW | 1 | N20 |
| 12 August at 11:24 | 19 MW | 1 | Terra |
| 12 August at 04:43 | 76 MW | 2 | Aqua |
| 12 August at 04:15 | 8 MW | 4 | N21 |
| 12 August at 03:32 | 34 MW | 11 | N20 |
| 12 August at 03:11 | 48 MW | 15 | N |
| 12 August at 02:35 | 42 MW | 14 | N21 |
| 11 August at 21:49 | 85 MW | 4 | Terra |
| 11 August at 14:57 | 9 MW | 1 | N |
| 11 August at 14:21 | 33 MW | 2 | N21 |
| 11 August at 13:36 | 13 MW | 2 | N20 |
| 11 August at 13:17 | 10 MW | 2 | N |
| 11 August at 10:43 | 9 MW | 1 | Terra |
| 11 August at 05:45 | 6 MW | 1 | Aqua |
| 11 August at 04:36 | 2 MW | 1 | N21 |
| 11 August at 03:49 | 1 MW | 1 | N20 |
| 11 August at 03:32 | 2 MW | 1 | N |
| 11 August at 02:56 | 5 MW | 2 | N21 |
| 10 August at 14:40 | 5 MW | 1 | N21 |
| 9 August at 14:14 | 34 MW | 5 | N20 |
| 9 August at 13:53 | 51 MW | 6 | N |
| 9 August at 13:17 | 40 MW | 4 | N21 |
| 9 August at 03:34 | 2 MW | 1 | N21 |
| 9 August at 02:48 | 10 MW | 4 | N20 |
| 9 August at 02:28 | 27 MW | 5 | N |
| 8 August at 14:14 | 3 MW | 1 | N |
Follow live
The map shows active fires in 3D, with smoke plumes, forecast wind, drop zones and the live position of the Canadair, Dash 8 and Air Tractor aircraft of the French Sécurité civile.
Open the fire map© 2026 SARO · Gistin. All rights reserved. The interface, its presentation and the contents of GISFire are protected; reproducing or imitating them requires written permission. The source data remain the property of their respective producers, see the credits.